Chuks Chiazor

Data Scientist
Hello there, my name is Chuks Chiazor
Professional data scientist, researcher, nature enthusiast, and lifelong learner. I am fascinated by the transformative power of technology in shaping how we live.
I am currently an active fellow at the Royal Statistical Society, with an M.Sc. in Business Intelligence and Analytics from The University of Huddersfield, I have over seven years of experience in harnessing data-driven methodologies, statistical modeling, and machine learning. My journey in the field has been focused on driving business growth, enhancing customer experiences, and optimizing profitability. I specialize in developing customer behavioral algorithms, leveraging visualization tools, and managing comprehensive research projects. These skills have been instrumental in my track record of successfully transforming data infrastructures, deriving critical insights, and formulating actionable recommendations.
Being a lifelong learner, I thrive in collaborative environments and excel in communicating complex data insights in a clear, impactful manner. I am deeply passionate about using data to inform strategic decision-making. I’m always eager to take on new data science challenges or explore fresh ideas. If you’re interested in collaboration, whether it’s tackling a new data science problem or brainstorming innovative concepts, I’d love to connect and see how we can create something amazing together.
Contact Information
Email: Chuks Chiazor
Skills
Programming language: Python,R, SQL, Tableau, and Power BI
Data Analysis/ Machine Learning Tools: Alteryx,SPSS, NUMPY, and Pandas
Data Visualization Tools: Tableau, Power BI, and MS Excel
Other Tools: Docker, Google Analytics 4, SAP ERP, Saleforce CRM, Adobe Photoshop, and Arena
Education
-
M.Sc. Business Intelligence and Analytics [Distinction] The University of Huddersfield, UK (Completed February 2022) -
B.Sc. Plant Biotechnology The University of Benin, Nigeria (Completed October 2015)
Professional Experience
Senior Data Scientist @ BPP Holdings (February 2023 - Present)
- Identify opportunities to employ statistical modeling, machine learning, and other data-driven and AI methodologies for BPP Marketing team.
- Developed and optimize the Marketing Media Mix model which resulted in improvement in model performance for product promotions, budget distribution, and Lead forecasting, saving thousands of pounds in potential losses.
- Developed a novel MMM UI application for the effective deployment of the MMM Model, designed to assist stakeholders in planning their marketing budget and forecasting prospective student numbers for different marketing budget scenarios.
- Developed a Natural Language Processing (NLP) model that extracts information from RFI forms in real-time, aiding the marketing team to efficiently prioritise leads and potential students.
Data Scientist @ Quantnumerics(August 2020 - December 2022)
- Developed a customer purchase intent prediction model using logistic regression, achieving an accuracy of 82% on the test dataset.
- Conducted A/B Testing for website optimization, leading to 10% increase in conversion rate.
Data Analyst @ JISC (January 2022 - January 2023)
- Conducted data scraping, extraction, cleaning, organization, and analysis to identify Higher Education Institutions in the United Kingdom committed to investing in Learning and Teaching products. Gained insights into their agreements and spending patterns to inform business strategies.
- Formulated and automated the KPI reporting process, providing real-time insights to identify areas of improvement for members. Achieved a 20% increase in customer value through actionable recommendations.
- Developed Interactive Analytics UI Dashboards for digital resource management and digital content negotiated by Jisc improving members (HE and FE Institutions) usage and value discount offered by Jisc.
Communication Analyst @ Novo Health Africa (March 2017 - July 2020)
- Conducted analysis and reporting, visualizing a wide range of online performance data, and presenting to Management.
- Introduced a dynamic email service, and produced the first ever ‘Novo Strivia’ and Health Hacks media programs.
- Set up and managed a team of media volunteers.
Projects
Classifying Music Genres with PCA and Logistic Regression
Project’s Github page with script
In the era of digital streaming, there’s an increasing need to categorize and recommend music based on genres. By analyzing various musical features extracted from tracks, we can delve deeper into their defining patterns. In this music genre classification project, you’ll work with a dataset containing various musical features extracted from tracks across different styles. (Completed in November 2024).
Deploying Models and Visualization with R Shiny
Project’s Github page with script
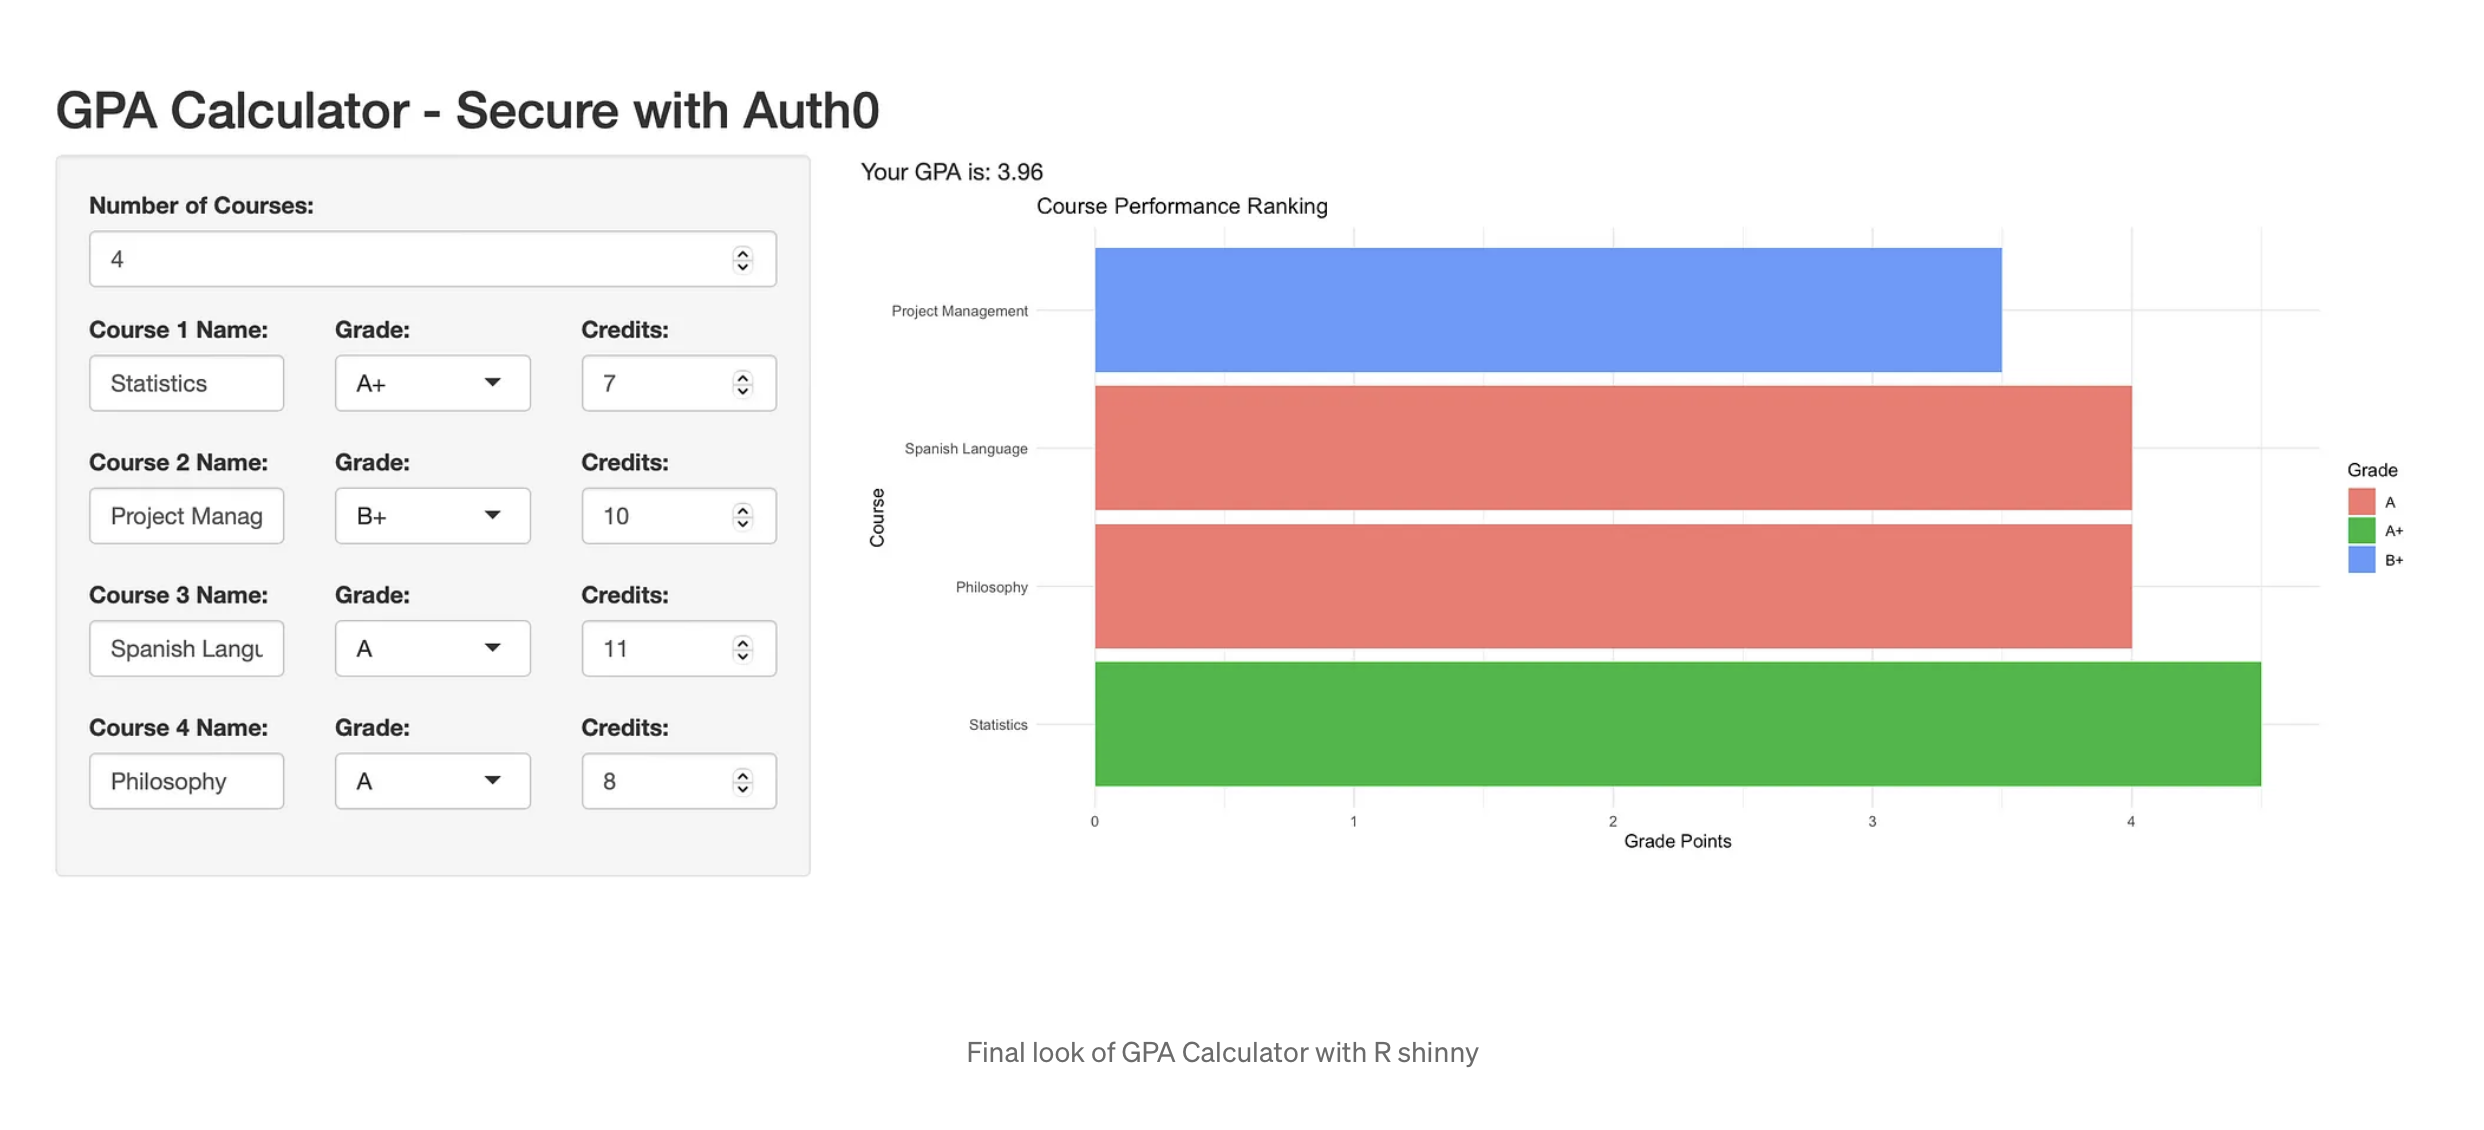
Developing, visualising, and deploying models with R Shiny allows data scientists and statisticians to create powerful, interactive, and user-friendly charts and web applications. By bulidng a college GPA calculator as an example, I’ve demonstrated the process of building a Shiny app from scratch, highlighted its importance for educational institutions, and outlined the benefits over traditional applications. Shiny thus represents a valuable tool in the modern data scientist’s toolkit. (Completed in January 2024).
Deciphering Amazon’s User-based Recommendation System
Project’s Github with more details
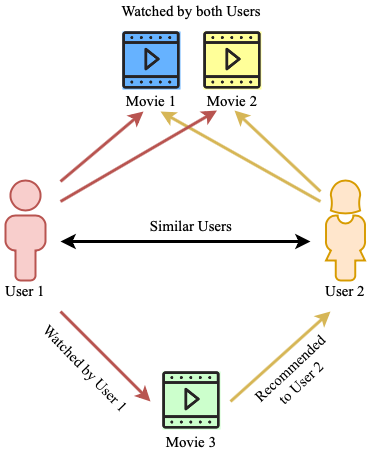
This project offers a step-by-step guide to creating a movie recommender system using Amazon’s movie ratings dataset. By the end of this guide, you’ll gain not just technical know-how but also insights into the practical applications of such models, particularly in shaping personalized educational tools, a blend of data science and educational innovation. Surprise library (SVD Algorithm) was utilized as the recommender system. (Completed in October 2023).
Student Success Prediction with SAT Scores
Project’s Github with more details
For educators, it’s sad to see students struggle and drop out. The goal of this analytics project was to predict the GPA scores of college students based on their SAT scores and attendance. A regression model was used, as well as stats models library in Python. The findings from the project can be used by educators to identify poor-performing students at risk of dropping out on time and provide targeted support and personalized learning. (First Completed April 2020. Updated July, 2023).

Leveraging Analytical Tools for Barratt Development PLC’s Strategic Investment Decision
Project’s Github with more details
This report aims to provide sufficient advice on Barratt as a good company for investment based on existing data and to provide prospective investors with an understanding of the company’s overall financial performance. To accomplish this, descriptive, time series, and fundamental analysis were carried.
From the analysis, Barratt has a higher mean return and standard deviation. This however implies that Barratt has both the higher return and volatility/risk. The regression line had a good fit between Barratt and Berkeley Returns. The time series forecasting analysis suggests Simple Exponential Smoothing method as the most suitable forecasting model due to its lower Moving Average Error and highest (four) forecast line points matching with the test price line (ground truth or expectation). (Completed in April 2022)
Exploring the immigration to Canada
Project’s Github with more details
Analysing and ranking countries that immigrated to Canada between 1980 and 2013, with insights into events that may have played a role in/influenced their immigration. Python, Pandas, Matplotlib (Completed in November, 2020)
Exploration of Walmart Retail Sales Data
Project’s Github with more details
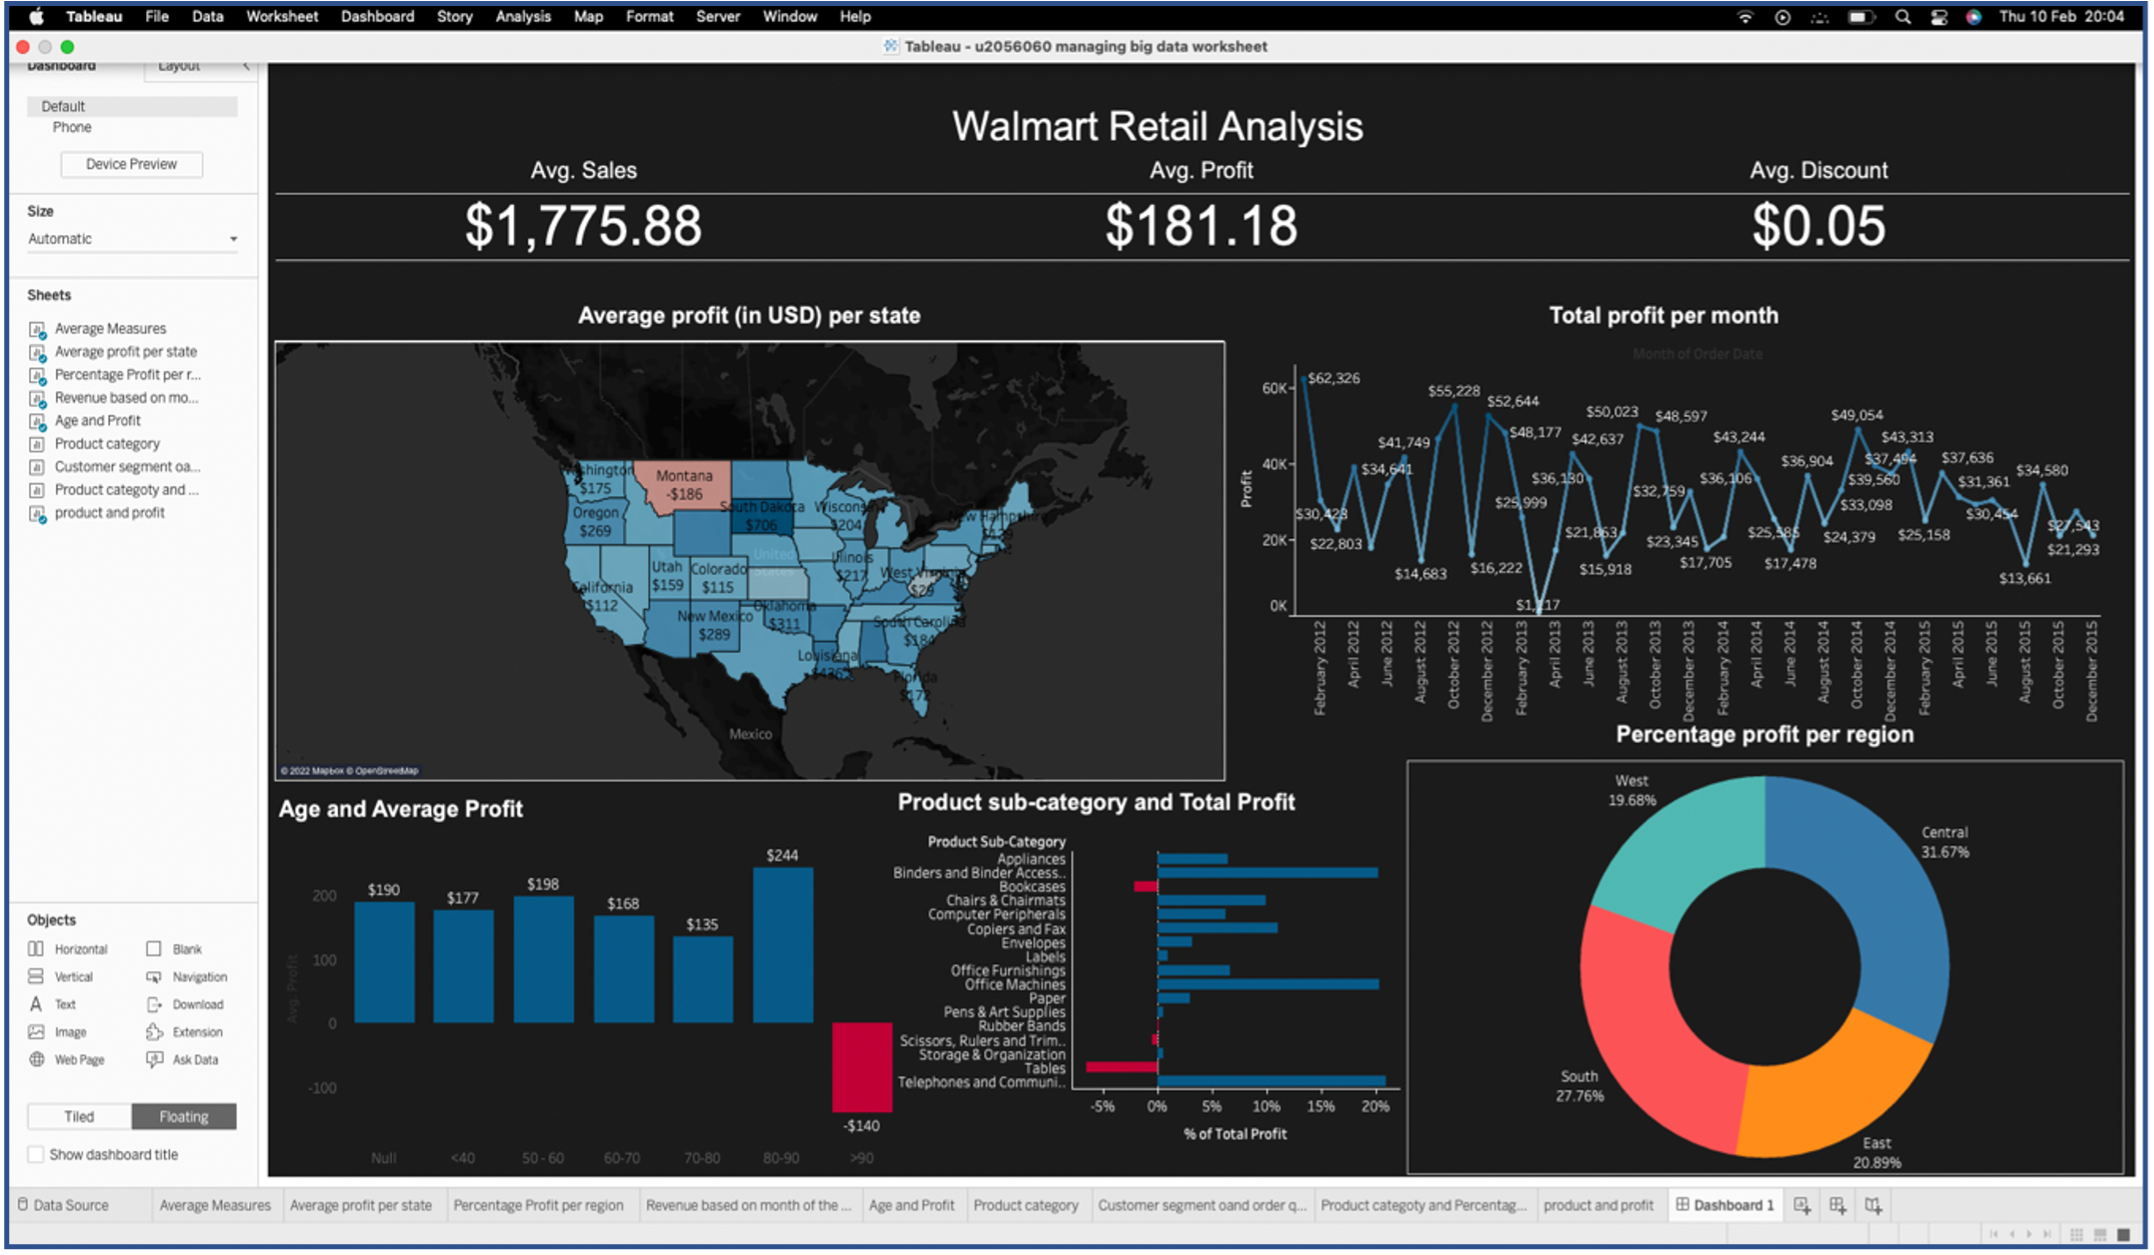
Descriptive Approach: The goal of this study is to investigate Walmart’s retail sales using Tableau software in a descriptive approach with six metrics - average sales, profit, and discount, distribution of average profit by state in the United States, percentage of profit per region, sales profits per month, average sales profit based on age, and Sub-category per average profit. (Completed March 2022)
Student Audience Interest in Selected Data Science Topics
Project’s Github with more details
The goal of this project was to understand students’ interest in some selected data science topics using numpy and pandas and matplotlib for visualization. (Completed November 2020).
Presentation
-
S.C Chiazor, C.A Omonhinmin, 2018. Impact Evaluation Study of Biotechnology Publishing in Nigeria 31st Annual International Conference of the Biotechnology Society of Nigeria.
-
Guest Speaker: Positioning as a tech talent for 2024 - Mentor Techies, Dec 2023
Articles
- Deciphering Amazon’s User based Recommendation System.
- The future of AI and Data Science: Exciting Times Ahead for the UK Economy.
- How Predicting College GPA scores Inspired a Journey of Discovery.
- Classrooms of tomorrow: 7 ways AI is shaping the Future of Education.
- Bias and Fairness in AI: Ensuring Just Outcomes in Critical Domains.